

Quacquarelli Symonds BRICS Ranking 2018
metricas.edu
The publication of this year’s BRICS analysis has brought the typical variety of headlines as like in the QS Latin America ranking, USP has slipped behind Unicamp into 13th position. While this will always generate the largest headline, there are much more important lessons to take from this ranking.
As we know, in terms of research performance, USP and Unicamp are extremely close, with USP being favoured in non-size normalised assessments, and Unicamp benefitting more from size-normalised assessments. This is because of USP’s tremendous size and publishing capacity, and Unicamp’s smaller size and concentration of talent. Different types of ranking benefit each institution. UNESP’s similar minor fall in position has passed almost uncommented upon, nor does its impressive positioning in this ranking generally attract comment.
The Quacquarelli Symonds rankings are commercial rankings, designed to demonstrate market position and expertise of the eponymous consultancy, who sell higher education management consultancy to universities wishing to position better in the ranking. It is produced in conjunction with the Russian media agency Interfax.
The QS BRICS ranking is now into its fourth edition, and follows a similar set of indicators to the QS Latin America ranking. The full methodology is reproduced below for reference:
2018 Methodology
| Indicator | Description | Weighting | Source | |
|---|---|---|---|---|
| Academic Reputation | Based upon a survey of academics, who are asked to list up to 30 universities that they consider outstanding in their fields. The survey is composed of almost 110,000 responses worldwide (aggregated year to year). | 30% | QS Internal (not published) | |
| Employer Reputation | This survey is similar to the academic one above, with employers from around the globe asked to give their opinion on up to 30 universities, carried over as the aggregated score of five years’ responses. | 20% | QS Internal (not published) | |
| Faculty: student ratio | This is designed to be a proxy for attentiveness of teaching, and is simply the ratio of full-time equivalent students to full-time equivalent staff (note that this is not headcount, but FTE; part-time students and staff are judged as worth 1/3 of a full time member of staff).Staff included: vice-chancellors, deputy vice-chancellors, principals and deputy principals, professors, heads of school, associate professors, assistant professors, principal lecturers, readers, tutors, researchers, research fellows or postdoctoral researchers who contribute to teaching or research or both at your university for a minimum period of at least three months. Excluded: research assistants, PhD students who contribute to teaching, hospital residents who do not teach and/or undertake research in addition to clinical duties, exchange scholars and visiting faculty staff who are members of a university other than yours. Also excluded are staff that hold an academic post but are not active due to retirement or honorary appointment. | 20% | Portal MEC and IBGESelf-reported data via Core | |
| % of International Faculty | This is the percentage of academic staff who are international.International is defined by citizenship, not by time in country or educational background. Visiting researchers and professors are not included in this count.In case of dual citizenship, the ‘deciding’ criteria should be ‘citizenship obtained through birth’, basically first passport obtained. | 2.50% | Portal MEC and IBGESelf-reported data via Core | |
| % of International students | The percentage of all students who are international, according to the same criteria outlined for academic staff; by nationality.Exchange students are disqualified from this count. | 2.50% | Portal MEC and IBGESelf-reported data via Core | |
| % of Staff with PhDs | Number of academic faculty staff working at the institution during the last annual reporting period that have been awarded a PhD or equivalent terminal degree.The annual reporting period is the last complete academic, financial or calendar year, whichever is easier to collect. A terminal degree is the highest academic qualification in a given field. | 10% | Self-reported data via Core | |
| Papers per faculty | Number of papers indexed on Scopus per FTE-equivalent member of staff, for whom the definition is the same as for the indicators above. | 10% | Scopus Index | |
| Citations per paper | The number of citations collected by the set of papers indexed on Scopus divided by the total number of papers. | 5% | Scopus Index |
Normalisation
All scores are reported as z-scores from a range of 0-100. A z-score is calculated by the following formula:
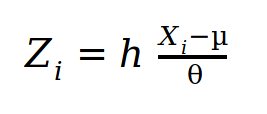
This means that the score represents the distance from the mean value of the sample. A score of exactly the mean gives a score of 50. This contextualises the score well, and gives an easy to understand idea of the position in a given data set. It does not, however, lend itself to time series comparison, as the mean of the data set inevitably moves each year, meaning that variations in score do not necessarily imply a change in the real score, therefore a change in scores is a change relative to the mean, not an absolute change. The score is especially susceptible to an increase in the sample size, which is common in regional or sub-rankings, as they seek ever larger numbers of universities to include, and broader global reach. Indeed, the QS BRICS ranking has grown from a top 200 at launch in 2015, to a top 400 today. Therefore, the significance of scores must be considered carefully.
Importance to Brazilian universities.
As with any ranking, it is important to select what we view as of fundamental importance to higher education development, and what is of only peripheral importance. This helps more intelligent tracking of ranking performance.
The QS BRICS ranking always generates headlines among the general press, and is therefore important to respond to from a public dimension. From another, more pertinent reason for the importance of BRICS-level regional rankings is that they offer a vital comparative middle group between national and Latin America rankings. USP, Unicamp and UNESP tend to dominate the latter, and therefore they do not provide especially motivating targets, while the goal of reaching the upper parts of the former can seem like a daunting and unrealistic aim. BRICS level rankings place the university in with a set of comparably expanding higher education systems that began from a relatively similar base, in similarly large countries with a desire to impose themselves on the global economy. In this sense, these rankings provide a good subset of universities to compare to Brazilian public universities.
Indicators relevant to Brazilian universities
Global reputation, is not a representation of institutional performance, or necessarily even an expression of privileged or expert knowledge as QS claims. Offering an academic the chance to list up to 30 institutions means that there cannot possibly be close control of the level of knowledge respondents have. It is, however, an important reflection of the perceived position of the university, which has important consequences for the formation of research networks, access to international funding opportunities, and the way in which the university’s graduates are viewed by the global job market. These data are never released to the public, and so are unverifiable, but they do form an important part of how the university interacts with the wider world.
Student:staff ratio is not a good proxy for teaching quality, as it says nothing at all about the quality of the materials delivered. International comparison of teaching quality has proven to be much more complicated than comparison of research performance. Therefore, while this measure is deeply unsatisfactory, it is the one chosen by QS. Furthermore, due to the restricted autonomy that public universities have in hiring new staff or reducing the number of students, it is not something that does, or should, figure highly in decision making processes. A reduction in the number of places is not something that would be acceptable to the general public, where the demand is for ever more places, and the universities are substantially impeded from contracting more staff. In any case, the evidence that smaller classes lead to better teaching is questionable at best. This indicator should not figure highly in decision making, it is a descriptive factor not an indicator of impact.
Internationalisation of the student and staff body is helpful to a certain extent. Because it excludes visiting professors and students and exchange, as well as international research networks and coauthorships, it misses a huge range of vital mobility activities that the universities carry out, and which have important roles in improving research performance. It is not wholly surprising that Brazilian public universities do not score especially highly in this aspect, as attraction of full time permanent students has never been a major priority like they are for the UK or the US, given that there is no financial incentive for the university.
The number of staff with PhDs is a useful indicator for universities and systems at a lower level of development than the state of São Paulo, but as all three universities have scored 100 in this metric since the ranking’s beginning, it is not something the requires specific attention.
Papers per faculty is a measure of productivity, not of production. This is often misunderstood or confused in rankings. As such, it is not a measure of the university’s contribution to global knowledge but a descriptive indicator of the research environment.
The most important indicator for the São Paulo state universities in this ranking is citations per paper, even though it is only worth 5% of the total. Although field normalised citation impact (FNCI) is one of a large range of indicators of impact, it is the single best indicator that the universities have of their performance relative to the global mean. Furthermore, while it only contributes 5% of the score in this subranking, it contributes to 20% of the global ranking, and so is a predictive indicator of how the universities will perform in the next QS world ranking.
Types of university the QS BRICS favours
The QS is normalised by size in publication output (per FTE staff), and citation rate rather than net citations, giving a combined 10% of its score. It also gives 20% of its score to faculty:student ratio. This means that it will naturally favour smaller, more research intensive universities than large universities with huge production outputs and other areas of lower output (for contrast, the Shanghai Jiao Tong ARWU heavily favours large universities, and both USP and UNESP perform relatively better than Unicamp). In this sense, we would expect Unicamp to perform relatively better than USP or UNESP, as it is afforded a natural advantage by its smaller size and more research intensive focus.
Changes
For the 2018 edition, paper counts per faculty and citations per paper are now normalised by field. This makes citation impact much more representative as it takes into account the normal behaviour within a given scientific discipline. It means that small institutes focusing on physics, for example, should not have an outsized advantage in citation assessments.